More VC Math
Breaking down a deal.
The book gives a case in which a VC firm is considering an investment in a startup, which is pitching for a $100,000 seed deal.
As we’ve said many times already, when VCs first look at a startup, we are thinking holistically about the entire life of the investment, not just the Series A. We will map out in our heads a best guess as to every round of investment on the way to exit.

For this case, while the startup is pitching a $100k seed round, the VCs are thinking about the A, B and C rounds, and are (internally) guessing that it may look like this:
- Seed round: $100K investment on a $1M pre-money valuation
- Series A: $1M on $2M
- Series B: $5M on $10M
- Series C: $20M on $40M
- Exit: $200M
Of course, this is all an educated guess, but this type of educated guessing is a key component of thinking like a VC. In this scenario, we start with a $100,000 seed round, followed by a Series A, B and C. Each follow-on round dilutes the ownership of earlier shareholders. In this case, each follow-on round happens to be diluting by 33% (1 on 2, 5 on 10 and 20 on 40). There is no magic to the 33%; it’s mostly just coincidence. If we anticipated hitting a huge milestone, for example, there would likely be a bigger jump in valuation between rounds.
I’ll walk you through the math later, but for now, take a look at the effects of dilution:
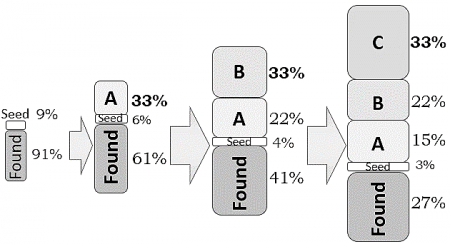
Every round projected is an up round, or course, as we are forecasting success. The seed investment of $100,000 on a $1M pre-money yields a post-money of $1.1M. The Series A has a pre-money of $2M. This implies that milestones must have been hit, as the value has increased approximately 1.8X.
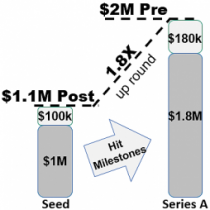
The seed investors’ $100,000 investment is now worth $180,000 (on paper), and the $1M worth of stock owned by the founders, as determined by the seed round pre-money valuation, is now worth $1.8M. The image to the left shows the pre-money breakdown; the $1M investment is not in there yet. (Series A is a 1 on 2 round.)
Similarly, between the A and B rounds, we are projecting a healthy up round, going from a Series A post-money of $3M to a Series B pre-money of $10M, or a 3.3X increase. Finally, from Series B to Series C we see another increase of 2.7X, from a post of $15M to a pre of $40M.

With the $200M exit projected in this case, the splitting of proceeds is represented in this pie chart.
The seed investors and founders, while suffering dilution, benefit from all of the up rounds. Multiply them all (1.8 x 3.3 x 2.7 x 3.3) and you get just over 54X on the way to a $200M exit. Series A enjoys three bumps, 3.3 x 2.7 x 3.3, or 30X. Series B has two jumps, 2.7 x 3.3, or 9X.


You can see why a firm would want to participate in the early rounds, with 30-55X returns for the seed and Series A. However, very little capital was put to work. If VCIC. II only participated in the seed and A rounds, they would not have returned even half of their $75M fund. Total proceeds for seed and A are $5.4M + $30M = $35.4M.
After the Series A, VCIC Ventures owned 39% (6% from the seed and 33% for Series A). If they were able to maintain pro rata through the B and C rounds, holding at 39% at exit, they would indeed return the fund with this investment: 39% of $200M = $78M.
We will now dive into the weeds of the math so that you can understand how all of this works. The algebra gets pretty complicated, and we’ll use a cap table to keep up with all the moving parts. However, I’ll will attempt to keep it all in perspective so that we don’t fall too deep into a spreadsheet!
Seed Round
In the seed round, this particular startup had very low capital needs ($100,000) to hit the next milestones. Some VC firms would not bother with an early stage investment like this. They would “pass” and ask the startup to come back when they were ready for their first institutional round.
However, VCIC Ventures’ strategy is to find early stage deals like this. The purpose of the seed investment is to get an early seat at the table for the Series A, as the returns from seed investing will not likely move the needle on the fund (see the previous section: total returns on the seed investment were $5.4M).
For the seed round, VCIC Ventures invested $100,000 on a $1M pre-money valuation, resulting in a 9% ownership stake.
VC % ownership = investment/post
$100,000/$1,100,000 = 9%
On a cap table, the seed round would look like this:

You can view and create a copy of this capitalization table in Google Sheets by clicking here. The chart above is a tab called “Seed Round.”
{end of excerpt}